
The first 30 days of a deployment
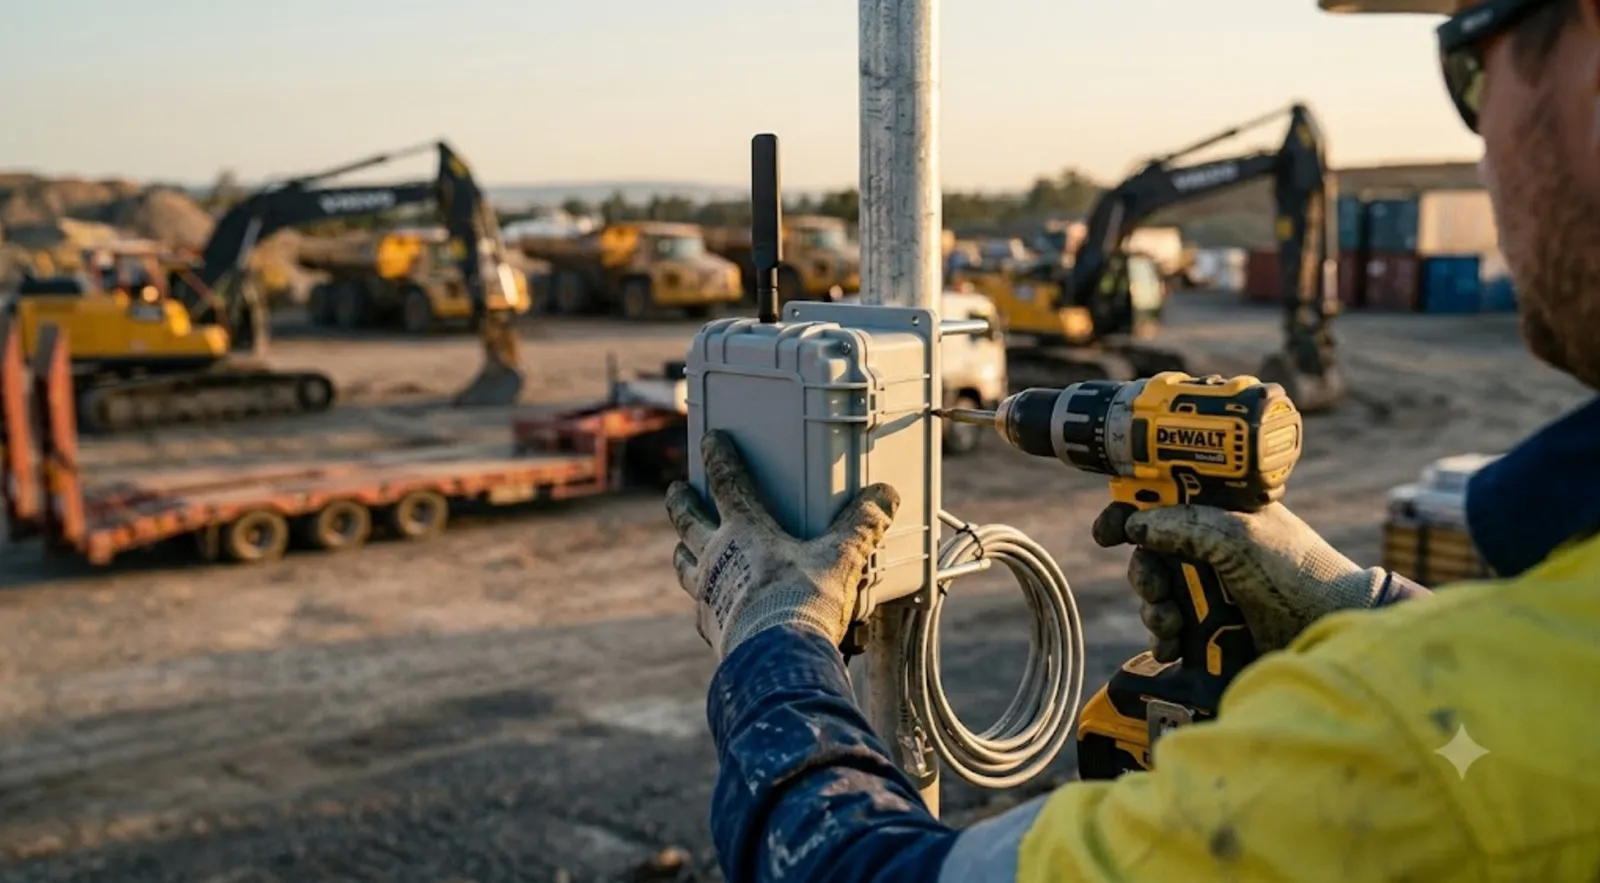
The day a customer signs the PO, the hard part hasn’t started. Hardware that’s been racked, powered, and verified is maybe 40% of the job. The other 60% is the first 30 days — the stretch where the data is captured but not yet trusted, the failures are predictable but not yet found, and the site decides whether this thing is infrastructure or a nuisance.
This is a composite of the deployments that went well. None of it is a single customer; all of it is something we’ve seen.
Day 0 — the survey already happened
Before any of this, a tech spent two hours on site with a signal meter and a test beacon. We don’t quote an install without a site survey, and the survey is genuinely day zero of the deployment — it’s where the bill of materials, the gateway count, and the connectivity profile get decided. If you’re reading this thinking “we’ll survey during the install,” that’s the first thing that goes sideways.
Week 1 — the install
Install week has a concrete definition of done, and “the hardware is mounted” is not it. What we want at the end of the week:
- Every gateway mounted to the building shell or a structural mast — never to equipment that moves — and visible in Fleet, reporting signal and firmware.
- Overlapping coverage verified by walking the footprint with a test beacon, the way we described in the yard, not assumed from a datasheet range.
- Assets tagged, with the advertising interval tuned to the site rather than left at the factory default.
- Backhaul up, power and ground checked, battery backup sized for the worst-case outage so the gateway survives a dead zone.
- GPS-tagged photos of every mount, and a named on-site contact with a phone number.
The last one is load-bearing. The maintenance person who’ll stand under a gateway in six months is not the tech who installed it.
Week 1–2 — the failures that always show up
There’s a short list of things that go wrong in the first two weeks, and it’s the same list almost every time. None of them are surprises; all of them are cheaper to catch now:
- The dead zone nobody surveyed — a corner of the site where assets actually work and the gateway can’t see them. Found with the test beacon, fixed with a gateway move, not discovered in month three.
- The breaker shared with a welder. A gateway that reboots every time someone strikes an arc looks like a flaky device and is actually an electrical problem.
- The IT contact on vacation. Half the install delays we’ve ever had were a firewall rule nobody could change because the person who owns it was out.
- The untagged rental. A machine shows up that nobody told us about, and it’s invisible until someone puts a beacon on it.
Week 2–4 — shadow mode
Here’s the part nobody budgets for, and the part that makes or breaks the cutover.
For the first weeks, telemetry is captured but not authoritative. The site keeps doing whatever it did before — the clipboard, the OEM portals, the spreadsheet. We run in parallel on purpose, because the telemetry number and the existing number are going to disagree, and the disagreement has to be reconciled per asset before anyone trusts it.
The two big reconciliations:
- CMH. The dashboard and the logbook will differ — we’ve seen 4% to 22%, and both numbers are usually wrong in different ways. Every asset needs an explicit offset captured against its on-board hour meter, signed off by someone who actually read the meter.
- Definitions. Is the number ignition-on, engine-running, or under-load? Pick the one that matches the service intervals and write it down. A precise number measuring the wrong thing is worse than an approximate one everyone understands.
Shadow mode is annoying. It’s also the only thing that turns the cutover from a month-long argument about which number to trust into a thirty-minute meeting.
~Day 30 — the reconciliation and the cutover
Around day 30, we sit down with the ops lead and walk every asset: here’s the telemetry number, here’s your number, here’s the offset and definition we’re proposing, sign off. Then we cut over. Telemetry becomes authoritative. The clipboard becomes a place for incident notes, not hours.
This is also when the system stops being something the site watches and starts being something that watches the site. The morning summary email and scheduled reports turn on. Alerts get tuned to the connectivity profile so they don’t cry wolf on a known dead zone. The dashboard becomes the thing the ops lead sweeps once with their coffee.
What a good day 30 looks like
The checklist we want green before we call a deployment done:
- Every gateway healthy, with verified overlapping coverage.
- A signed-off CMH offset and an agreed definition for every asset.
- Alerts tuned — stale told apart from alarm — so the first week’s pages were real.
- A named site contact who knows what to do when something goes offline.
- Reports scheduled to the right people on the right cadence.
- The clipboard retired to incident notes.
The thing that makes it stick
The temptation is to measure a deployment by install day — hardware up, lights green, sign the completion. But the deployments that quietly become infrastructure aren’t the ones with the cleanest install. They’re the ones where somebody held the discipline of not trusting the number until it was reconciled, and tuned the alerts until the site stopped ignoring them.
Installing the hardware is most of the visible work. Teaching the site to live with it — and earning the number the site believes — is the part that determines whether anyone’s still using it in year two.
If you’re planning a deployment and want to know what the first month actually looks like before you commit, get in touch. We’d rather set the expectation now than manage it later.